
ALL MATERIAL COPYRIGHT KEVIN SCOTT 2011. LINKS TO THIS SITE ARE WELCOME BUT DO NOT COPY MATERIAL FROM THIS SITE TO ANY OTHER WEBPAGE.


If you find this site useful, please support it by making a donation of $1 to help maintain and develop it. Click on the PAYPAL DONATE button to do this safely. But there is no obligation - please avail yourself of the information and facilities of the site at no charge.
A Transient Barometric Event Recorder was used to measure the pressure changes encountered in the cabin of a commercial airliner during take-off, flight and landing. The transient detection threshold was set to 0.65mB/sec and the instrument set to record to its in-built datalogger during the flight of an Avro RJ85 Airliner from Edinburgh to Paris.
The transient recorder collected 3400 measurements of the pressure during the 100 minute flight, collecting data frequently when the pressure was changing rapidly, and less so when the rate of change was slight. The data is presented below:
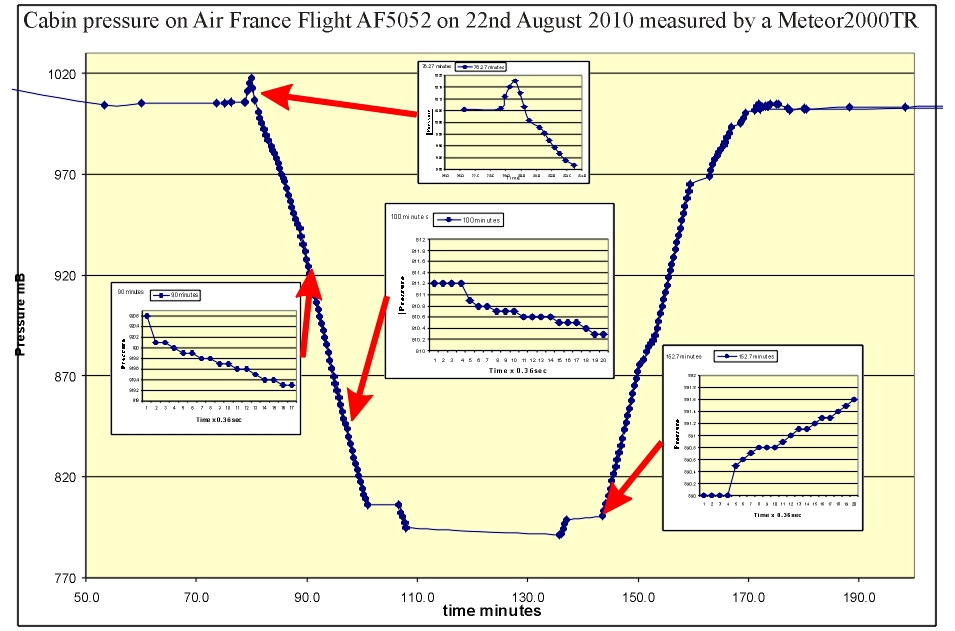
The main plot shows the features expected:
(1) A progressive decline in pressure during the ascent of the aircraft
reaching a minimum pressure of 795mB corresponding to an altitude of 2011 metres. This is within the permitted pressure range which has a lower limit
corresponding to 2400 metres.
(2) Just before take off, the pressure in the cabin increased momentarily to about 1020 mB, presumably
as the internal pressure control was implemented.
(3) The maximum slope of the pressure readings was about 11.1 mB/minute
as determined by a least-squares regression of pressure data obtained at the steepest point in the descent. (See figure 2).
(4) There were evidently two smaller changes in pressure during the flight presumably corresponding to changes in cruising altitude
to enable the main part of the flight to take place at a specified height.
(5) The general pattern of pressure changes were reversed
as the aircraft descended and landed.
(6) Each point on the plot above represents the detection of an event which triggers the recording of
20 consecutive measurements separated by a selected interval of 0.35 second. The inset graphs show selected plots of these
sets of data from recorded events.
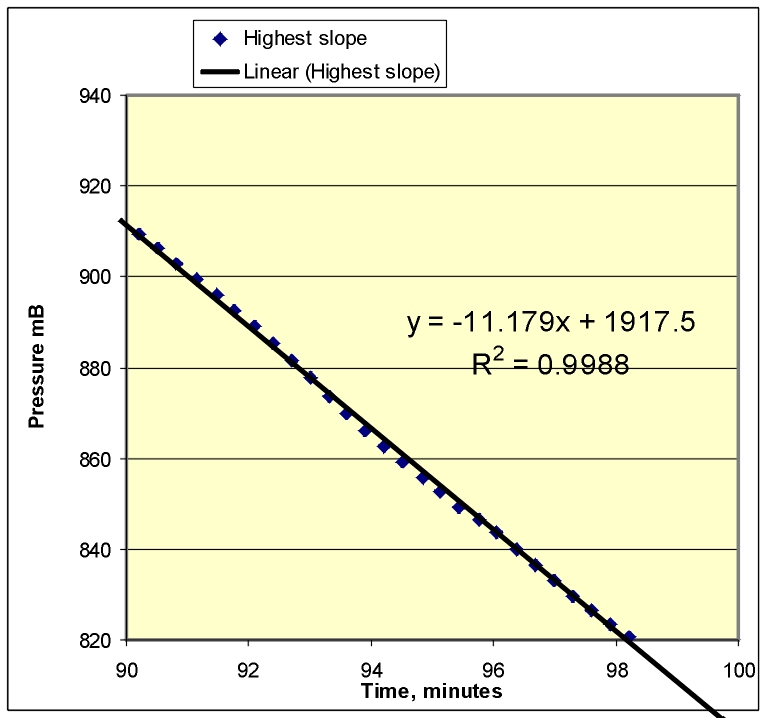
Figure 2. A least-squares fit of pressure data obtained at point of steepest descent during take-off.
The internal pressure of a pressurised cabin is a compromise between passenger comfort & health and stresses on the aircraft structure. Cruising altitudes of commercial airliners lie mostly between 30,000 feet and 41,000 feet. (9000 -12500 metres)
| Altitude m | external pressure | pressure difference in-out |
|---|---|---|
| 9000 | 355 mB | 445 mB |
| 9500 | 335 mB | 465 mB |
| 10000 | 317 mB | 483 mB |
| 10500 | 300 mB | 500 mB |
| 11000 | 283 mB | 517 mB |
| 11500 | 268 mB | 532 mB |
| 12000 | 253 mB | 547 mB |
| 12500 | 239 mB | 561 mB |