
ALL MATERIAL COPYRIGHT KEVIN SCOTT 2011. LINKS TO THIS SITE ARE WELCOME BUT DO NOT COPY MATERIAL FROM THIS SITE TO ANY OTHER WEBPAGE.


If you find this site useful, please support it by making a donation of $1 to help maintain and develop it. Click on the PAYPAL DONATE button to do this safely. But there is no obligation - please avail yourself of the information and facilities of the site at no charge.
With a deep winter forecast for the UK in 2012/2013, the question arises as to the reliability of dry cells which, by necessity, have to be exposed to outside temperatures while delivering current. This page describes some tests which were made in response to such an enquiry.
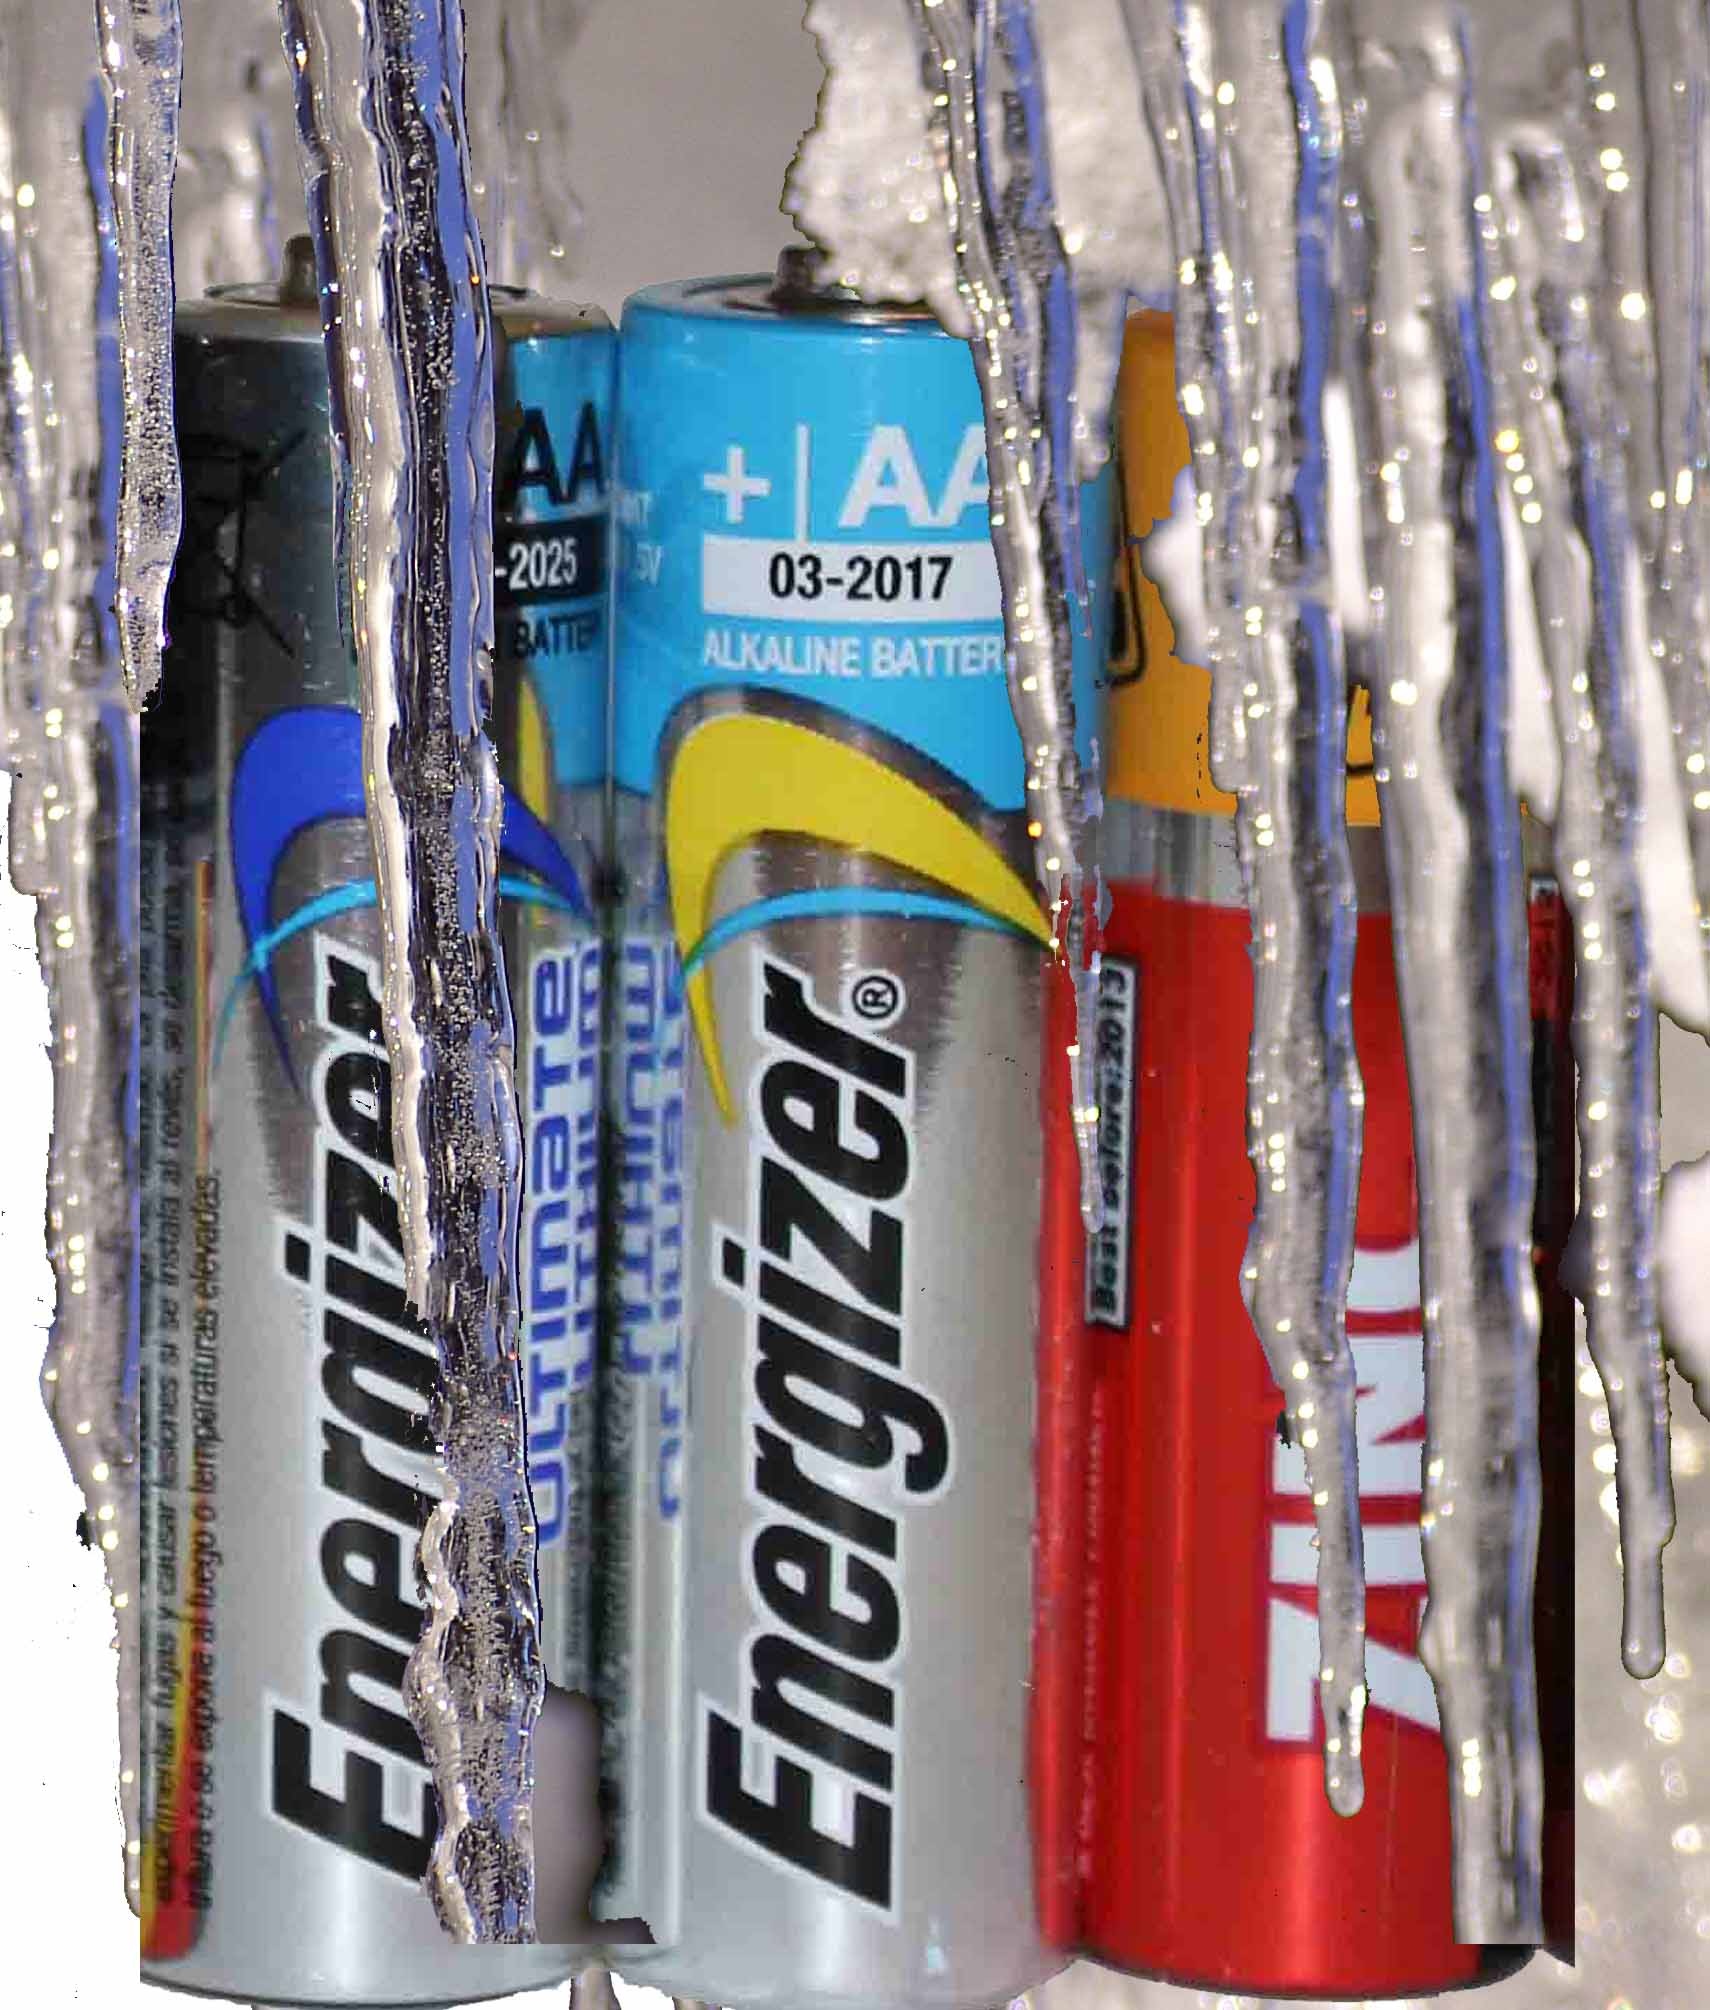
According to the previous study of battery performance, the Energiser range outperformed others by several criteria. Two of the Energiser range were thus selected for this study, the Lithium Ultimate, and Alkaline Ultra cells in AA size. These were compared with each other and with a JCB Zinc-Carbon AA cell. A Zinc-Carbon cell was not available from Energiser.
The apparatus employed for the tests is shown below. The cell under examination was suspended in a peltier cryostat described here, and surrounded with 60-80 Petroleum Ether which ensured an electrically insulating, thermally conductive environment for the cell. The cell voltage was measured using a Solartron 7150 6-1/2 digit multimeter with a computer interface as described here, and a variable load could be applied to the cell by means of a resistance box.
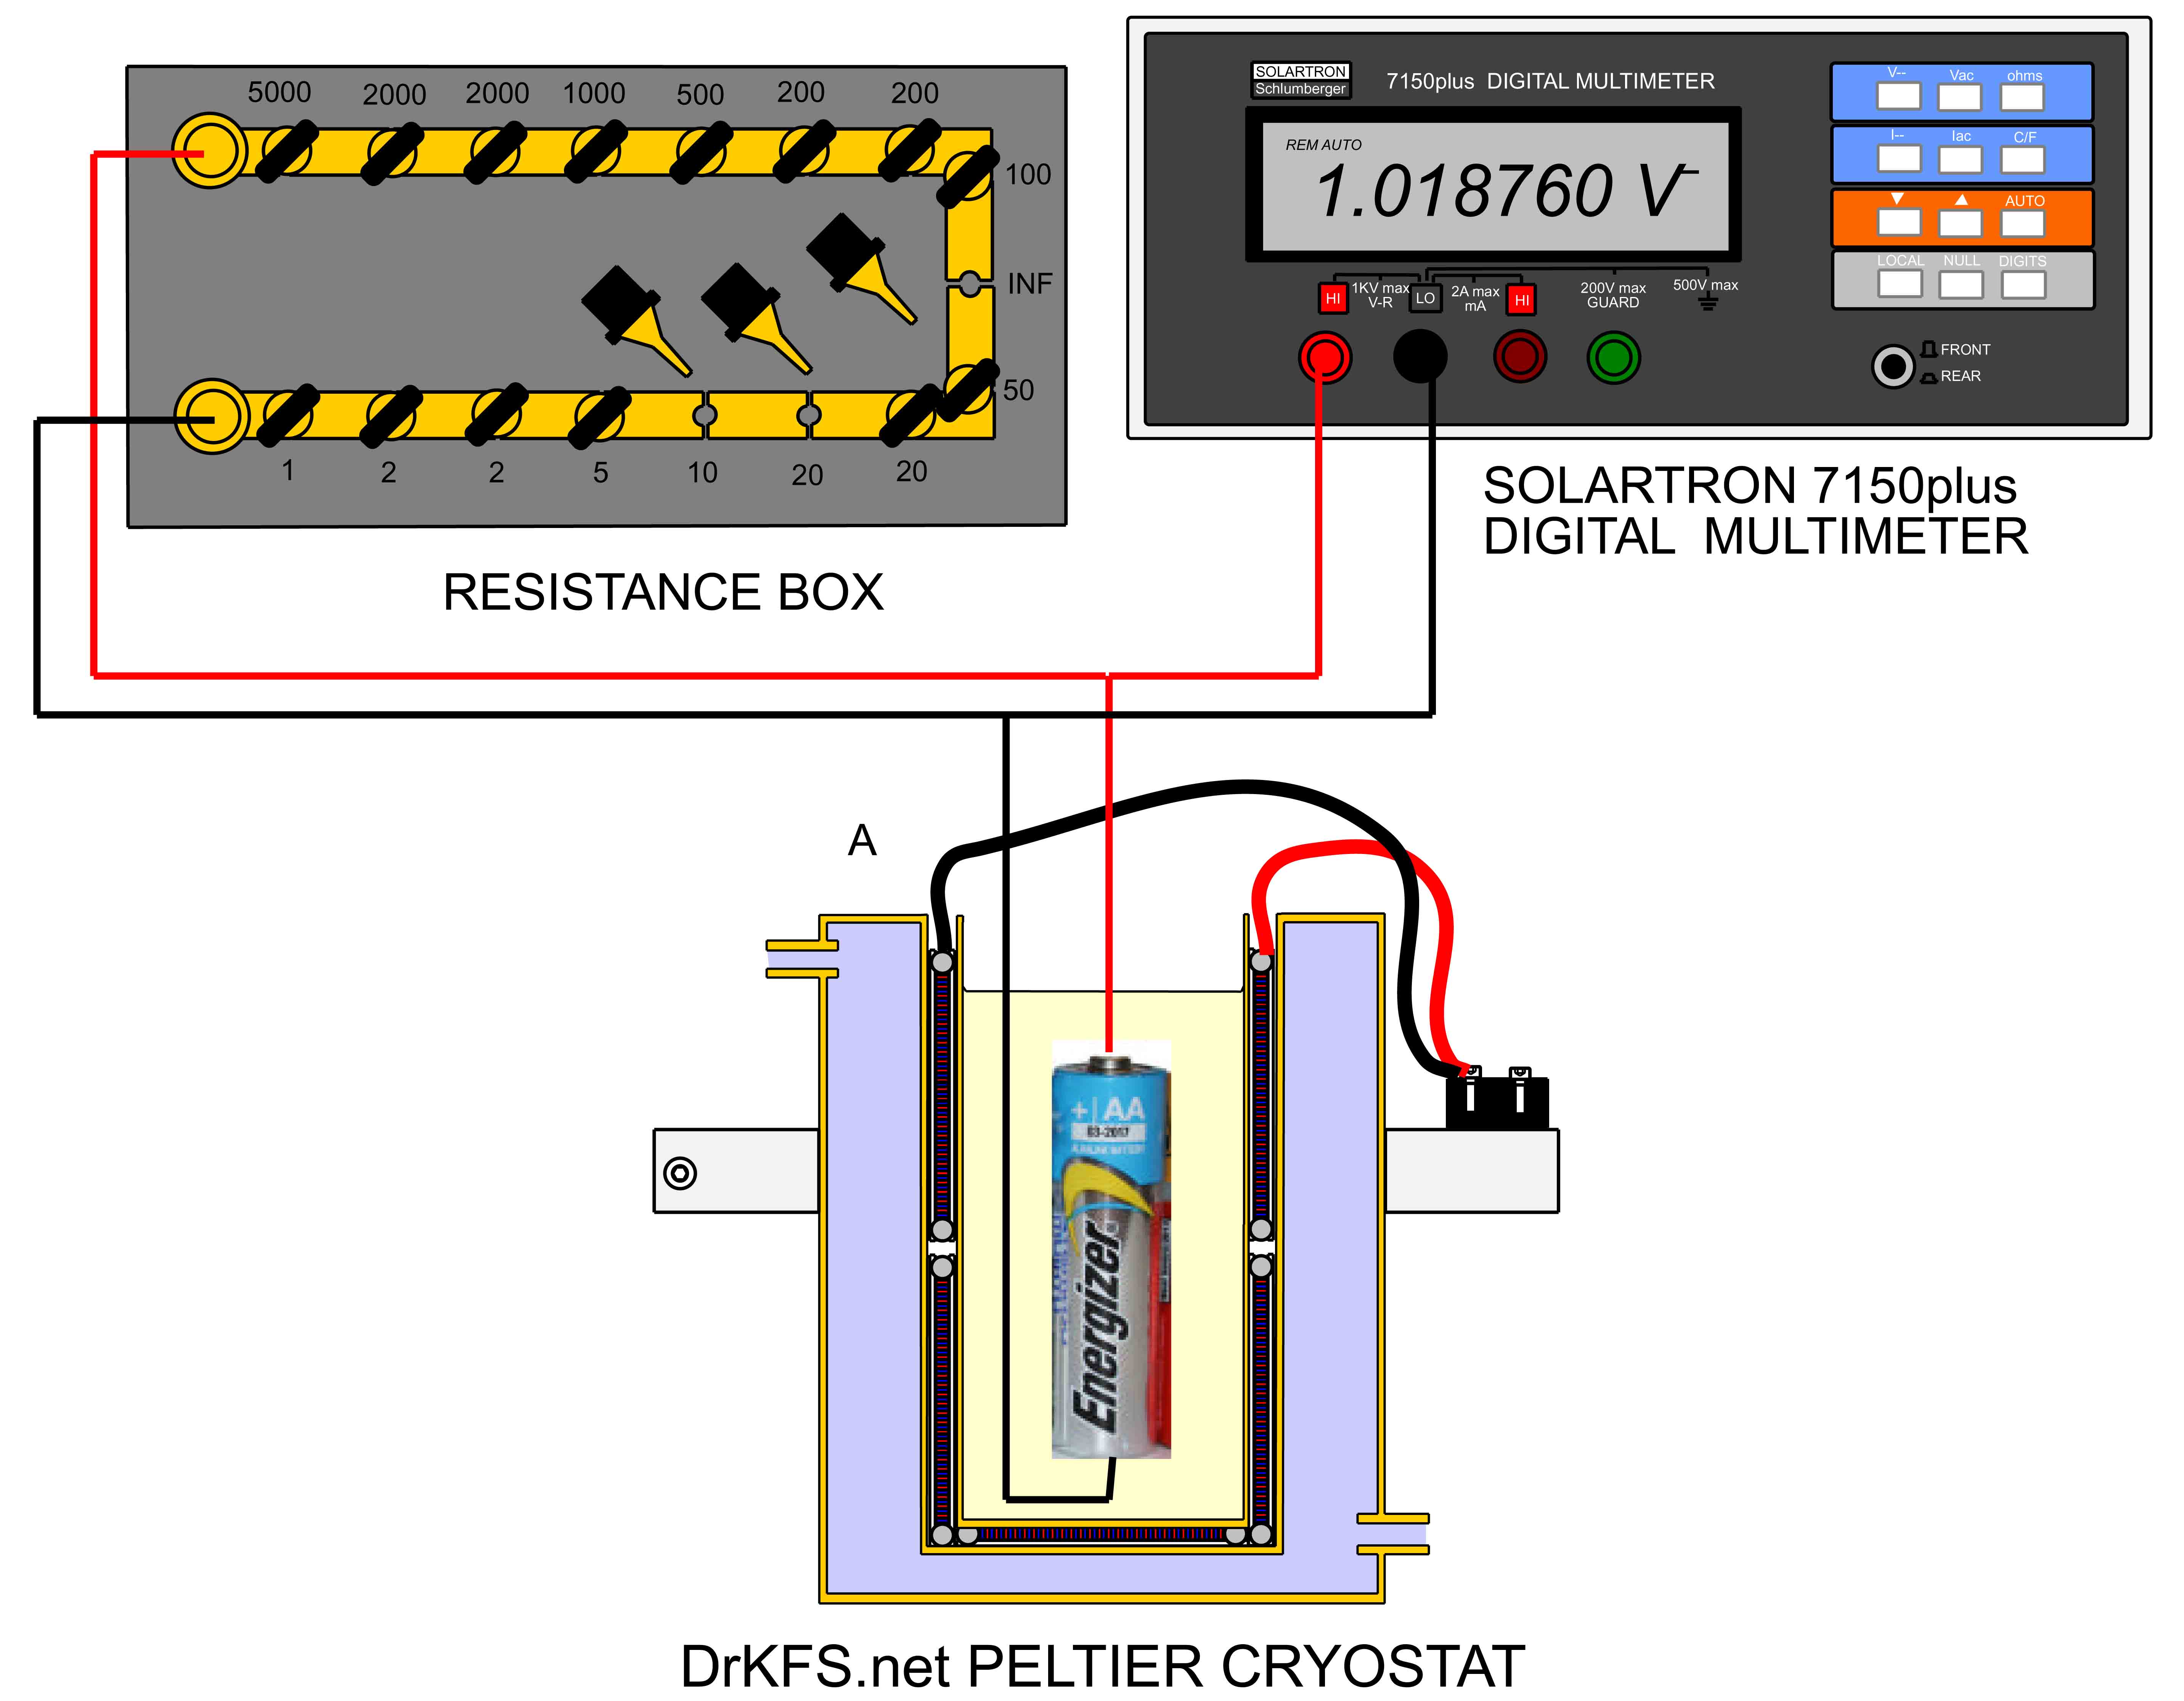
By applying current to the peltier cryostat, the temperature of the cell under test could be adjusted from about 10 C to -30 C, and open-circuit terminal voltage of the cell (EMF) and the terminal voltage at a 150 ohm loading were measured at 5 degree intervals in this temperature range. The voltage measured from each cell under these conditions was subject to some slight drift which of about 0.05mV/second maximum associated with the adjustment of the internal chemistry of the cell as the load of 150 ohms was alternately applied and removed.To eliminate the effect of this drift, measurements were taken at 3 minute intervals after every load change.
Battery performance at low temperatures
| ZINC CARBON | ALKALINE | LITHIUM | ||||||||||
| TEMP | EMF | V at 150R | Current | Int R | EMF | V at 150R | Current | Int R | EMF | V at 150R | Current | Int R |
| C | V | V | mA | ohms | V | V | mA | ohms | V | V | mA | ohms |
| 10 | 1.544 | 1.5136 | 10.09 | 3.012 | 1.5943 | 1.5855 | 10.57 | 0.8325 | 1.7187 | 1.6705 | 11.1367 | 4.3343 |
| 5 | 1.5425 | 1.5125 | 10.0833 | 2.9752 | 1.5916 | 1.5833 | 10.555 | 0.7892 | 1.6869 | 1.632 | 10.88 | 5.04596 |
| 0 | 1.456 | 1.422 | 9.48 | 3.5865 | 1.59248 | 1.58104 | 10.5403 | 1.0854 | 1.6548 | 1.602 | 10.68 | 4.9438 |
| -5 | 1.435 | 1.401 | 9.34 | 3.6403 | 1.5897 | 1.5788 | 10.5253 | 1.0356 | 1.631 | 1.5728 | 10.4853 | 5.5506 |
| -10 | 1.425 | 1.379 | 9.1933 | 5.0036 | 1.5906 | 1.576 | 10.5067 | 1.3896 | 1.6085 | 1.5472 | 10.3147 | 5.943 |
| -15 | 1.416 | 1.363 | 9.0867 | 5.8327 | 1.5879 | 1.5738 | 10.492 | 1.3438 | 1.5886 | 1.5242 | 10.1613 | 6.3377 |
| -20 | 1.41 | 1.344 | 8.96 | 7.3661 | 1.5888 | 1.5689 | 10.4593 | 1.9026 | 1.5697 | 1.4994 | 9.996 | 7.0328 |
| -25 | 1.404 | 1.321 | 8.8067 | 9.4247 | 1.5836 | 1.5649 | 10.4327 | 1.7924 | 1.5486 | 1.4846 | 9.8973 | 6.4664 |
| -30 | 1.397 | 1.2811 | 8.5407 | 13.5703 | 1.5851 | 1.5583 | 10.3887 | 2.5797 | 1.5357 | 1.4609 | 9.7393 | 7.6802 |
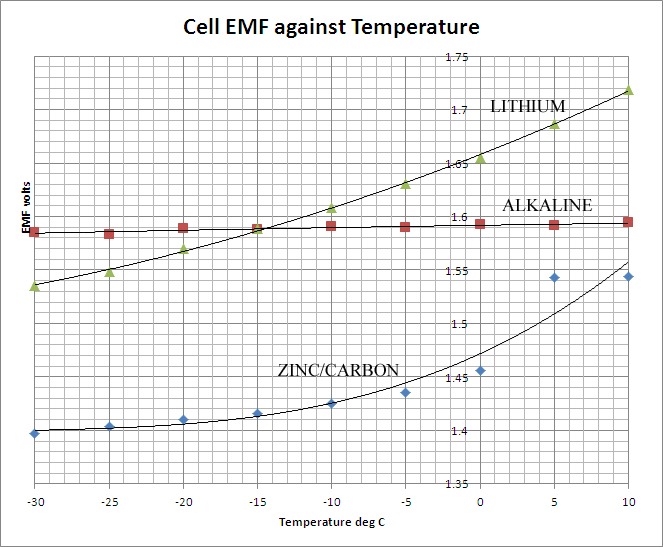
The table above shows the results of the measurements. There are two quantities of interest in evaluating the performance of the cells at reduced temperatures. The first is the EMF, the open circuit terminal potential difference. This is essentially a thermodynamically determined quantity, depending upon the internal chemistry of the cell and the effective concentrations (or more strictly, the activities of the electrolytes. Depending on the latter, the EMF may show a positive-, negative- or zero- temperature coefficient. In simple, reversible cells with liquid electrolytes, these quantities can be readily calculated and a theoretical value for the cell EMF obtained. With non-reversible dry-cells such as those of this study no such simple calculation is available, but the data shows that generally the EMF declines with decreasing temperature, the effect being most marked in the case of the Zinc-Carbon cell and least marked in the case of the Alkaline. The data are presented graphically below:
If any current is to be drawn from the cell, the internal resistance is of greater significance than the EMF in determining the cell's usefulness. Whereas the latter is determined by thermodynamic quantities, the former is controlled largely by kinetic processes, the mobility of the ions within the cell and the rate at which electrolytes can diffuse to and from the electrodes. These processes are slower at lower temperatures and so it is to be expected that the internal resistance of the cells should increase with decreasing temperature. This is borne out by the data which is presented graphically below:
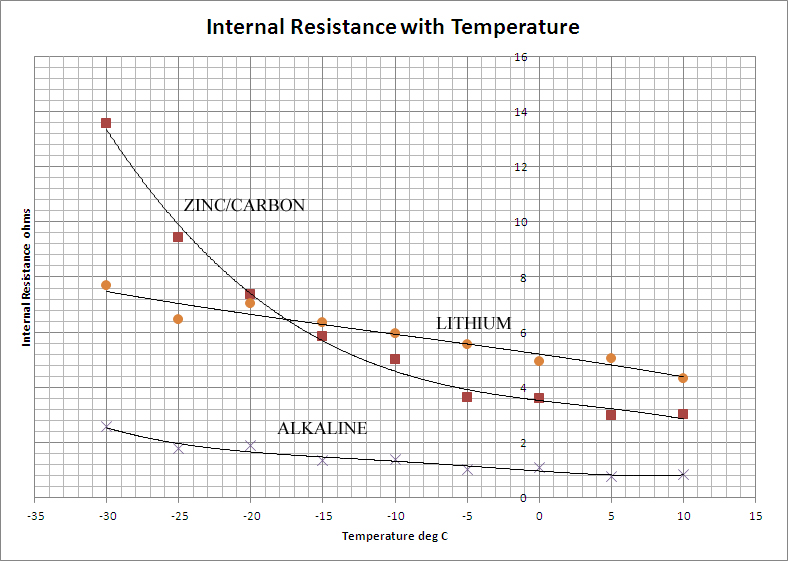
Once again, the Alkaline cell out-performs the others by a considerable degree. It shows a low internal resistance which increases only slightly with falling temperature. The Lithium battery is poorer on both counts, the internal resistance is much higher and increases more rapidly as the temperature falls. The Zinc-Carbon cell is the poorest of the three on the grounds of gradient, but has a lower internal resistance than the Lithium cell at normal temperatures.
The general conclusion is clear: any of the cells could be used for moderate demand down to about -10 C. Beyond that the Alkaline cell shows itself superior to the others at least as far as -30 C. Down to this limit, the alkaline cell is thus to be preferred at least in applications where the current drawn is of the order of 10mA.